Analysis of traffic congestion in Belgium
07.15
From 2008 to 2009
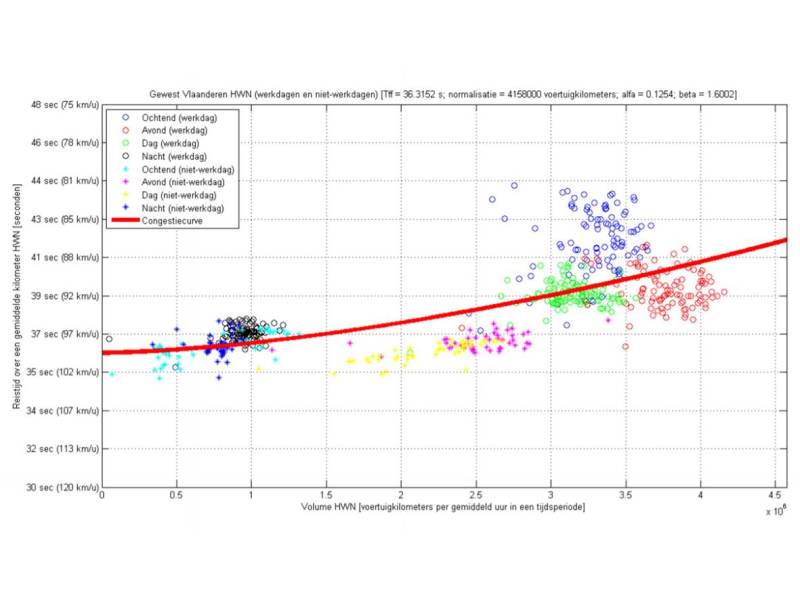
TML analysed the extent of congestion and its consequences in Belgium for the FPS Mobility and Transport, examining motorways as well as regional and urban roads. The team used traffic data from loop detectors and mobile phone/gps probes to gain a detailed understanding of the traffic situation.
Transport & Mobility Leuven carried out a study commissioned by the FPS Mobility and Transport to identify the extent of congestion and its consequences for Belgium. An innovative aspect of this study was that it looked at congestion for both the motorway network and the regional and urban road networks. We used traffic data based on measurements from loop detectors (START-SITTER) and GSM/GPS probes (Be-Mobile) for this purpose.
The main results of the study were as follows:
Except for fuel consumption and CO2, a strong decrease in emissions is expected, despite the increase in road traffic. This can be explained by the continuous renewal of the vehicle fleet and increasingly stringent emission standards. Only for CO2 is there an increase in emissions, because new vehicles are not sufficiently fuel-efficient to compensate for the increase in traffic.
Transport & Mobility Leuven carried out a study commissioned by the FPS Mobility and Transport to identify the extent of congestion and its consequences for Belgium. An innovative aspect of this study was that it looked at congestion for both the motorway network and the regional and urban road networks. We used traffic data based on measurements from loop detectors (START-SITTER) and GSM/GPS probes (Be-Mobile) for this purpose.
The main results of the study were as follows:
- In Flanders and Wallonia, traffic volumes are highest on the regional road network, followed by the main road network and finally the urban road network. In agglomerations, traffic volumes are higher on the main road network than on the regional road network. The increase in traffic volumes between 2007 and 2020 is greatest in Brussels.
- Loss times are especially large in Antwerp, Flanders, and Brussels; they are smaller in Liège, Ghent, and Wallonia. 67% of vehicle loss hours are incurred in Flanders. For Belgium as a whole, the number of vehicle loss hours on the secondary road network is greater by a factor of 3.9 compared to the main road network; the number of vehicle loss hours increases by 35% from 2007 to 2020.
- Average congestion lengths on the motorway network are shorter for the evening rush hour than for the morning rush hour. In addition, 91% of Belgium's traffic jams are found in Flanders. Between 2007 and 2020, a sharp increase in traffic jam lengths is observed on the main road network. For Belgium as a whole, the length of traffic jams on the main road network increases by 54%.
Except for fuel consumption and CO2, a strong decrease in emissions is expected, despite the increase in road traffic. This can be explained by the continuous renewal of the vehicle fleet and increasingly stringent emission standards. Only for CO2 is there an increase in emissions, because new vehicles are not sufficiently fuel-efficient to compensate for the increase in traffic.


