Impact analysis: shift from public means to public transport and active transport
18076
2019
Commissioned by Greenpeace Belgium, TML investigated how public funds could be better used for a more sustainable transport system. In doing so, we analysed current spending on different transport modes and modelled a scenario in which investments shift from road transport to public transport and active modes.
On behalf of Greenpeace Belgium, we conducted a study on policies to strengthen the backbone of a sustainable transport system.
The starting point of this study was the observation that, with unchanged policies, individual car use remains dominant. Moreover, climate targets are not being met, despite improvements in technology and shifts towards cleaner cars.
The question that arose was: what is the potential of shifting public resources to active modes and public transport?
Therefore, this study sought to provide insights into the following issues:
Results
The full report can be found in appendix. Below is a summary of the results.
1. How is money currently spent?
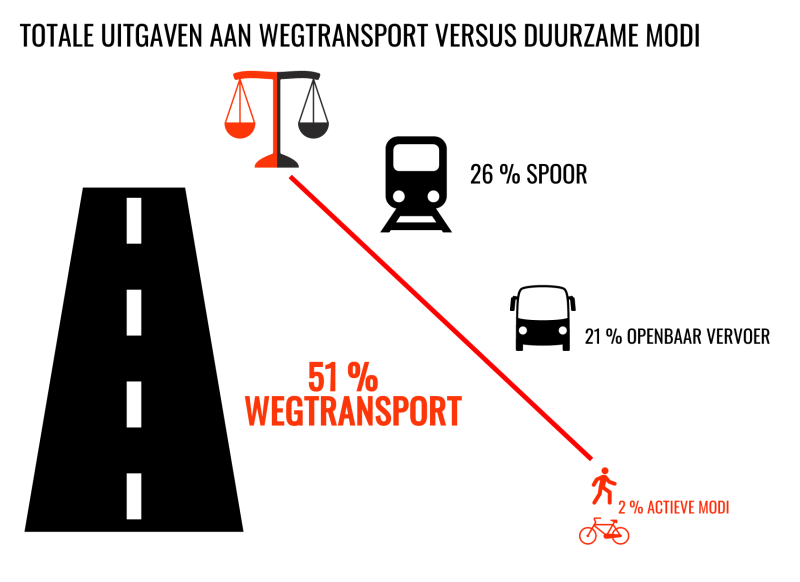
In terms of current spending, we saw that about half of the funds currently go to road transport (52%) and the other half to more sustainable modes. Remarkably, a significant part of spending on road transport goes to salary vehicles and professional diesel (37% of road transport spending).
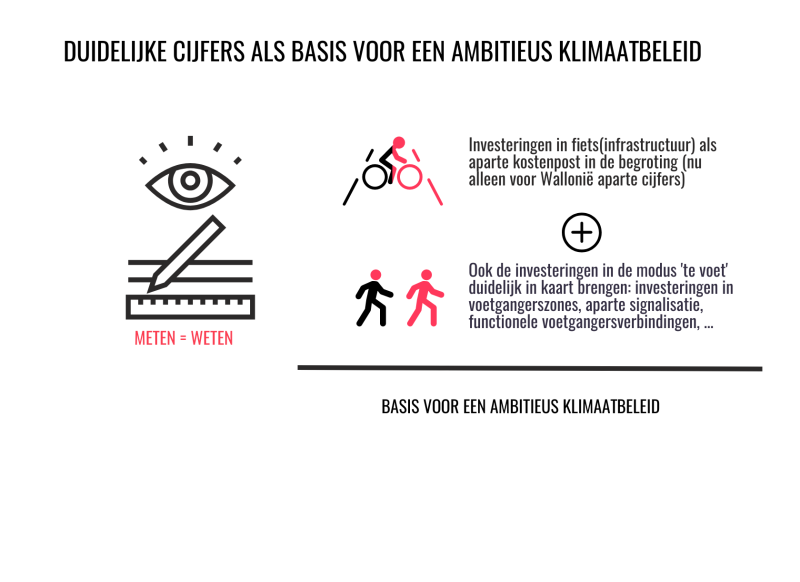
Regarding investment towards cycling, one of the main conclusions is that there is very little visibility on current spending for these modes. This is even more the case for pedestrians. A policy that really focuses on active modes should ensure that it has a clear view of spending on these modes.
In terms of tax benefits, the salary car is the clear winner. For instance, we estimate the tax benefit for the bicycle allowance at 70 million euros, that for public transport at 100 million and that for the salary car at 2 billion.
2. What if we give more money to public transport and active modes?
In the second part of the study, we used a spreadsheet to examine the possible effects on CO2, environment, congestion, and health of an alternative scenario. Specifically, this alternative scenario consisted of the following components:
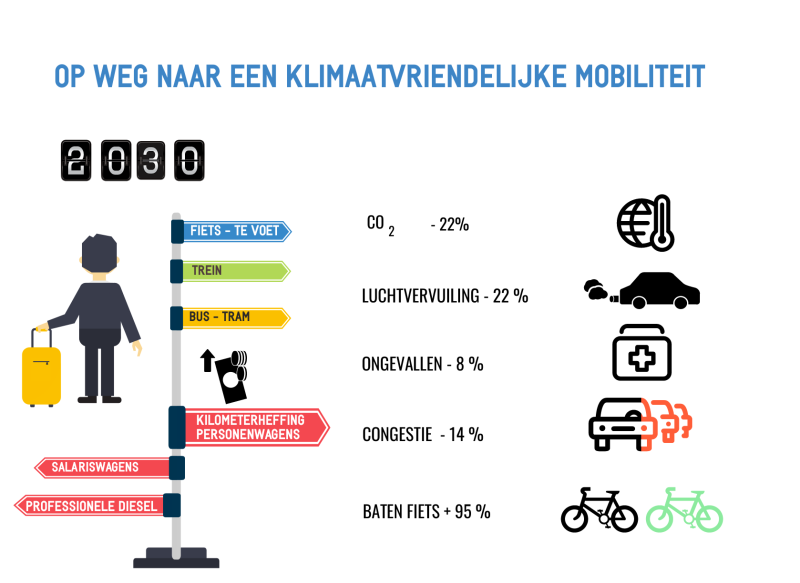
The result of this scenario was a marked decline in individual road transport (-22%) in favour of active modes (doubling) and public transport (+33%). Moreover, external costs fall by €1.5 billion. Nevertheless, this scenario also fails to meet the CO2 target of -35% between 2005 and 2030. In the alternative scenario, CO2 emissions fall by 20% compared to 2005 - which is better than in the reference (-8%), but still insufficient. To meet the target, there will therefore be a need for additional policies. These could be policies that ensure a further reduction in demand - for example, through higher charges or (in the longer term) better land use planning so that fewer trips are needed, or policies that ensure a stronger shift to electric vehicles. In the alternative scenario, we assume that 30% of new cars are electric, but this turns out to be insufficient. A kilometre charge that differentiates according to environmental characteristics or an adjustment of the BIV could help here, although some disruption will still be needed. Finally, we note that the alternative scenario focused mainly on passenger transport, but there may also be gains to be made in goods transport.
Over time, we do see spending towards road transport increasing (+10% over the last 5 years) and those towards train (-8% over the last 5 years) and public transport (-13% over the last 5 years) decreasing. As a result, the mode receiving the most in 2018 is road transport. In 2015, this was public transport + train (where train, like road transport, includes investments going to freight transport).
On behalf of Greenpeace Belgium, we conducted a study on policies to strengthen the backbone of a sustainable transport system.
The starting point of this study was the observation that, with unchanged policies, individual car use remains dominant. Moreover, climate targets are not being met, despite improvements in technology and shifts towards cleaner cars.
The question that arose was: what is the potential of shifting public resources to active modes and public transport?
Therefore, this study sought to provide insights into the following issues:
- The public resources currently going to the different modes: road transport, public transport, and active modes.
- The potential impacts on CO2, environment, congestion, and health of an alternative scenario where resources shift from road transport to public transport and active modes.
Results
The full report can be found in appendix. Below is a summary of the results.
1. How is money currently spent?
In terms of current spending, we saw that about half of the funds currently go to road transport (52%) and the other half to more sustainable modes. Remarkably, a significant part of spending on road transport goes to salary vehicles and professional diesel (37% of road transport spending).
Regarding investment towards cycling, one of the main conclusions is that there is very little visibility on current spending for these modes. This is even more the case for pedestrians. A policy that really focuses on active modes should ensure that it has a clear view of spending on these modes.
In terms of tax benefits, the salary car is the clear winner. For instance, we estimate the tax benefit for the bicycle allowance at 70 million euros, that for public transport at 100 million and that for the salary car at 2 billion.
2. What if we give more money to public transport and active modes?
In the second part of the study, we used a spreadsheet to examine the possible effects on CO2, environment, congestion, and health of an alternative scenario. Specifically, this alternative scenario consisted of the following components:
- Abolishing the salary car and the (often) accompanying fuel card.
- Abolishing professional diesel.
- Introducing an area-wide kilometre charge for passenger cars and vans.
- Using half of the proceeds from the above measures to encourage public transport and active modes.
The result of this scenario was a marked decline in individual road transport (-22%) in favour of active modes (doubling) and public transport (+33%). Moreover, external costs fall by €1.5 billion. Nevertheless, this scenario also fails to meet the CO2 target of -35% between 2005 and 2030. In the alternative scenario, CO2 emissions fall by 20% compared to 2005 - which is better than in the reference (-8%), but still insufficient. To meet the target, there will therefore be a need for additional policies. These could be policies that ensure a further reduction in demand - for example, through higher charges or (in the longer term) better land use planning so that fewer trips are needed, or policies that ensure a stronger shift to electric vehicles. In the alternative scenario, we assume that 30% of new cars are electric, but this turns out to be insufficient. A kilometre charge that differentiates according to environmental characteristics or an adjustment of the BIV could help here, although some disruption will still be needed. Finally, we note that the alternative scenario focused mainly on passenger transport, but there may also be gains to be made in goods transport.
Over time, we do see spending towards road transport increasing (+10% over the last 5 years) and those towards train (-8% over the last 5 years) and public transport (-13% over the last 5 years) decreasing. As a result, the mode receiving the most in 2018 is road transport. In 2015, this was public transport + train (where train, like road transport, includes investments going to freight transport).


